Alternatives - Not Good Enough
The Final Staff Assessment/Draft Environmental Impact Statement (FSA/DEIS) was released by the California Energy Commission (CEC) and Bureau of Land Management (BLM) on November 4, 2009 at http://www.energy.ca.gov/sitingcases/ivanpah/index.html.
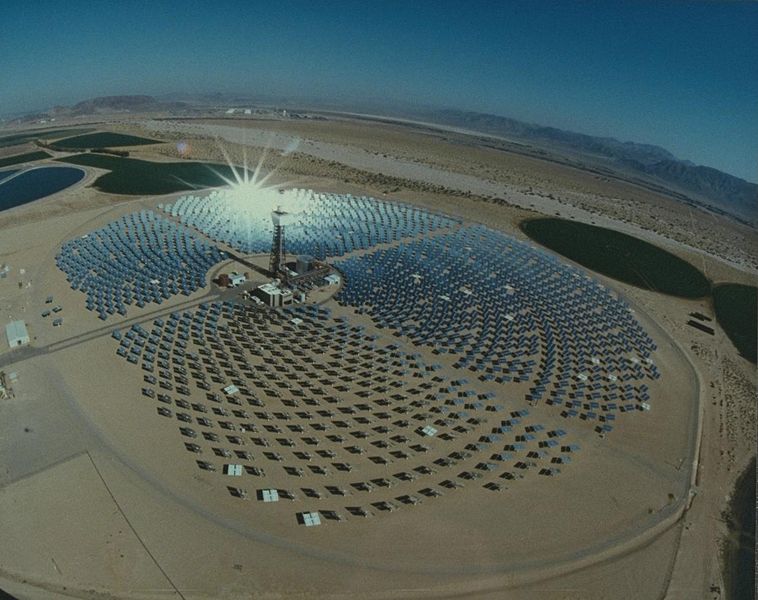
^ (Left) Solar 2 in Daggett, California, which BrightSource plans to scale up and expand to build ISEGS in Ivanpah Valley (right).
CEC and BLM claim that: "If this project is not approved, renewable projects would likely be developed on this and other sites in the Mojave Desert, or in adjacent states, as developers strive to provide renewable power that complies with utility requirements and state/federal mandates. For example, there are three large solar projects proposed on BLM land in Nevada within a few miles of the proposed ISEGS site. In addition, as of August 2009 there were 66 applications for solar projects covering 611,692 acres pending with BLM in the California Desert District" (page 6.2-66). This is not a good excuse for permitting such a land-wasting development.
BrightSource, according to the FSA/DEIS, chose the Ivanpah site "to avoid highly pristine or biologically sensitive areas" (page 4-11), which is laughable if you walk around the place.
Distributed Generation Eliminated as an Alternative
We quote the FSA/DEIS more fully to show there line of reasoning for eliminating this important alternative. Our comments as to why this is wrong follow. From the IVANPAH SOLAR ELECTRIC GENERATING SYSTEMS (ISEGS) FINAL STAFF ASSESSMENT, DRAFT ENVIRONMENTAL IMPACT ASSESSMENT AND DRAFT CALIFORNIA DESERT CONSERVATION AREA PLAN AMENDMENT, pages 4.62-66:
Distributed Solar Technology
Distributed solar generation is generally considered to use PV technology, but at slightly larger scales, distributed solar can also be implemented using solar thermal technologies.
Rooftop Solar Systems
A distributed solar photovoltaic (PV) alternative would consist of PV panels that would absorb solar radiation and convert it directly to electricity. The PV panels could be installed on residential, commercial, or industrial building rooftops or in other disturbed areas. In order to be a viable alternative to this project, there would have to be a
sufficient number of panels to provide 400 MW of capacity. California currently has 441 MW of distributed solar PV systems which cover over 40 million square feet (CPUC 2008b [BRW-this reference is not included in the FSA]). During 2008, 158 MW of distributed solar PV was installed in California, doubling the amount installed in 2007 (78 MW) (CPUC 2009 [BRW-this reference is not included in the FSA]). While small distributed solar PV systems are relatively common in California, large distributed solar PV installations are less so. Examples of proposed rooftop PV systems to attain large amounts of energy are the following:
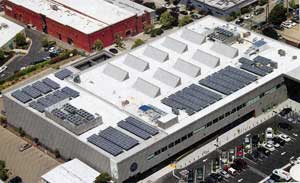
• Southern California Edison (Fontana, CA): Over 33,000 solar panels were attached to a 600,000-square-foot commercial roof, generating 2 MW of energy, using thin film PV technology provided by First Solar; this is the first installment of a planned installation of 3.5 million PV panels that would generate 250 MW of capacity (SCE 2008).
• San Diego Gas & Electric (San Diego, CA): Solar Energy Project is designed to install up to 80 MW of solar PV which would include parking structures and tracking systems on open land (SDG&E 2008 [BRW-this reference is not included in the FSA]).
• Pacific Gas & Electric (San Francisco, CA): PG&E launched a five-year program to develop 500 MW of solar PV power. The program would consist of 250 MW of utility- owned PV generation and an additional 250 MW to be built and operated by independent developers under a streamlined regulatory process. PG&E’s program targets mid-sized projects, between 1 to 20 MWs, mounted on the ground or rooftop within its service area (PG&E 2009 [BRW-this reference is not included in the FSA]).
• City of San Jose (San Jose, CA): The City of San Jose is considering the development and implementation of 50 MW of renewable solar energy on city facilities and/or land (San Jose 2009 [BRW-this reference is not included in the FSA]). San Jose’s Green Vision lays out a goal of achieving 100% of the city’s electricity from renewable energy by 2020; as part of this project, the City issued a solicitation for the installation of 50 MW of energy on City facilities and/or land in June of 2009 (San Jose 2009). The City anticipates that City facilities with appropriate solar access including parking lots, garages, lands and landfills would be eligible for solar installation.
• Like utility-scale PV systems, the acreage of rooftops or other infrastructure required per MW of electricity produced is wide ranging. As stated above, California has approximately 40 million square feet (approximately 920 acres) of distributed solar PV accounting for 441 MW installed (CPUC 2008b [BRW-this reference is not included in the FSA]). However, based on SCE’s use of 600,000-square-feet for 2 MW of energy, 120 million square feet (approximately 2,750 acres) would be required for 400 MW.
• Most rooftop PV systems in California are crystalline systems, and result in approximately 15 percent of sunlight converted to energy (SB 2009 [BRW-this reference is not included in the FSA]). The newer technology is thin film, which converts approximately 5 to 10 percent of sunlight to energy.
• San Bernardino County is estimated to have the technical potential for over 2,000 MW of distributed solar PV (CEC, 2007b). However, the location of the distributed solar PV would impact the capacity factor of the distributed solar PV.2 Capacity factor depends on a number of factors including the insolation3 of the site. Because
a distributed solar PV alternative would be located throughout the state of California, the insolation at some of these locations may be less than in the Mojave Desert. The Renewable Energy Transmission Initiative (RETI) assumed a capacity factor of approximately 30 percent for solar thermal technologies and tracking solar photovoltaic and approximately 20 percent capacity factor for rooftop solar PV which is assumed to be non-tracking (B&V 2008 [BRW-this reference is not included in the FSA] ; CEC 2009 [BRW-this reference is not included in the FSA])
Distributed Solar Thermal Systems
Solar thermal technology, specifically Concentrated Solar Power (CSP) technology, has also been adapted for use at distributed locations. In August 2009, eSolar began operations of a new distributed solar power tower technology. This technology uses small, flat mirrors which track the sun and reflect the heat to tower-mounted receivers
that boil water to create superheated steam (eSolar 2009 [BRW-this reference is not included in the FSA]). An example of the eSolar system is the Sierra SunTower, located in Lancaster, CA, which will produce 5 MW of energy on 20 acres of land for SCE (eSolar 2009). Each eSolar module locates one tower, one thermal receiver, and 12,000 mirrors on ten acres of land and produces 2.5 MW of power. Additionally, eSolar has developed a larger module, a 46 MW CSP plant that would include sixteen towers, a turbine generator set, and a steam condenser which would be located on approximately 160 acres (eSolar 2009).
An additional example of a distributed solar trough power plant technology is the Andasol 1 power plant in Spain. Andasol 1, generating 50 MW of power, went online in November 2008 (Solar Millennium 2008). The Andasol plant includes thermal storage systems which absorb a portion of the heat produced in the solar field during the day
and can run the turbines for approximately 7.5 hours at full load, regardless of the solar conditions at the time (Solar Millennium 2008 [BRW-this reference is not included in the FSA]). The Andasol 1 solar field is approximately 510,000 square meters or 127 acres (Solar Millennium 2008). This does not include the ancillary facilities. Both these technologies have been implemented recently and are described here as an example of the evolving distributed solar technologies.
Environmental Assessment
Installations of 400 MW distributed solar PV would require between 40 to 120 million square feet. Distributed solar PV is assumed to be located on already existing structures or disturbed areas so little to no new ground disturbance would be required and there would be few associated biological impacts. Minimal grading or new access roads would be required and relatively minimal maintenance and washing of the solar panels would be required. As such, it is unlikely that the rooftop solar PV alternative would create erosion impacts. Relatively large amounts of water would be required to wash the solar panels, especially with larger commercial rooftop solar installations; however, the commercial facilities would likely already be equipped with drainage systems. Therefore, the wash water would not
contribute to runoff or to erosion.
Because most PV panels are black to absorb sun, rather than mirrored to reflect it, glare would not create visual impacts as with the power tower, Fresnel, and trough technologies. Additionally, the distributed solar PV alternative would not require the additional operational components, such as dry-cooling towers, substations, transmission interconnection, maintenance and operation facilities with corresponding visual impacts. Solar PV panels would be visible to passing residents and may be viewed by a larger number of people.
Rationale for Elimination
Building 400 MW of distributed solar PV would require an even more aggressive deployment of PV at more than double the historic rate of solar PV than the California Solar Initiative program currently employs. Additional legislation for increased incentives may be required to achieve this level of penetration. The RETI Discussion Draft Paper California’s Renewable Energy Goals – Assessing the Need for Additional Transmission Facilities, addresses the likelihood of a scenario of sufficient distributed solar PV to remove the need for utility scale renewable
development. This discussion paper identified the factors likely to influence the pace of large scale deployment of distributed solar PV: subsidies, feed-in tariffs, manufacturing and installation cost, and manufacturing scale-up.
• Subsidies. PV installations have been subsidized by a variety of programs. Go Solar California (GSC) program is projected to add approximately 3,000 MW of grid-connected PV capacity by 2016 but the GSC subsidies are designed to decline over time and be eliminated by 2016. The assumption underlying the GSC program is
that the subsidies will increase installations and thereby manufacturing experience, which will in turn lower costs to a level at which PV generation is competitive with other sources of electricity. In 2008, Congress extended the 30% federal solar investment tax credit for eight years, to 2016, and made it available to utilities, thus opening the way to utility company ownership of relatively large-scale urban PV installations. This is expected to further bolster installation of PV (and other solar equipment). The GSC program is perhaps the most ambitious PV subsidy program
in the U.S., and should support continued rapid growth of PV deployment in California. But if the federal investment tax credit is not extended beyond 2016 and if California PV subsidies decline through 2016 and are absent thereafter, it may be difficult PV installations to meet current targets.
• Feed-in Tariffs. Feed-in tariffs (FIT) are fixed long-term prices for renewable energy. In California, the CPUC has approved FITs for installations up to 1 MW and is actively considering, in one of its RPS proceedings, an expanded FIT program. In its 2008 Integrated Energy Policy Report Update, the California Energy Commission recommended that the Public Utilities Commission implement a system of feed-in tariffs for projects up to 20 MW. Legislation introduced in the California Senate would create a Feed-in Tariff program in statute. The proposed legislation would also set payment at the Market Price Referent, a proxy measure for the cost of non-renewable energy, but allow the CPUC to adjust the payment rate to reflect the value of electricity generated on a time of delivery basis. The proposed legislation would, however, cap the cumulative generating capacity able to receive the FIT rate at 500 MW. Recent changes have been made to the FIT. In October, 2009 Governor Schwarzenegger signed Senate Bill 32, which amends the feed-in tariff and raises the project size cap to 3 MW from 1.5 MW and increases the statewide cap to 750
MW.
• Manufacturing and Installation Cost. There are signs that the cost of PV installations will continue to decline, perhaps substantially. “Thin film” PV collectors are less expensive to manufacture than conventional crystalline silicon modules. Given sufficient sales volume, economies of scale in thin film (and other PV technology) manufacturing could reduce the cost of PV installation and energy generated, perhaps to levels comparable to current energy prices. Thin film PV is less efficient than crystalline silicon PV and therefore requires substantially more
collector area (i.e., many more commercial or residential rooftops or ground area) to generate comparable amounts of electric energy. According to a study of PV system costs over the period 1998-2007, systems completed in 2006 or 2007 that were less than 2 kW in size averaged $9.00/Watt, while systems larger than 750 kW averaged $6.80/Watt. PV installed in residential new construction is significantly less expensive relative to retrofit installations. Widespread expansion of distributed PV beyond current programs, however, would require a large number of retrofit
installations. No matter how it is installed, relying heavily on PV greatly increases the total cost of meeting state renewable energy and GHG targets.
• Manufacturing Scale-Up. Shipments of “thin film” PV collectors totaled approximately 500 MW globally in 2008. While PV manufacturing plants are expected to develop quickly, the availability of financing and raw material supply
would need to increase proportionally to match an increased demand. Because the worldwide demand for PV is expected to continue to increase along with demand throughout the United States, the competition for this demand may affect the cost and schedule for increasing the use of distributed solar PV. Investor owned utilities, residential, and commercial deployment of distributed solar PV have increased rapidly in the last two years and contribute to the viability of this alternative. However, achieving 400 MW of distributed solar PV would depend on additional policy support, manufacturing capacity, and lower cost than currently exists. Additionally, while it is possible to achieve 400 MW of distributed solar PV, the Energy Commission’s Intermittency Analysis Project Final Report assumes 3,100 MW of concentrated solar power in addition to 2,900 MW of solar PV, or a total of 6,000 MW of solar power (CEC 2007c). Achieving 6,000 MW of solar PV to provide the renewable energy required to meet the California Renewable Portfolio Standard requirements would be challenging so additional technologies, like solar thermal generation, are also necessary.
References:
CEC 2007b – CEC/ R. Johnson (tn: 42282). Review of the Ivanpah AFC. Dated on 9/12/2007. Submitted to CEC / Docket Unit on 9/12/2007.
CEC 2007c – CEC/ R. Johnson (tn: 42283). Library Letter RE Document Handling for Ivanpah AFC. Dated on 9/12/2007. Submitted to CEC / Docket Unit on 9/12/2007.
SCE 2008a – Southern California Edison / K. Ahmet (tn: 46780). Update of Cultural Resources Work Planned for the Eldorado-Ivanpah Transmission. Dated on 6/12/2008. Submitted to CEC / Docket Unit on 6/23/2008.
SCE 2009a – Southern California Edison / N. Jackson (tn 51796). Notice of Application for Certification of Public Convenience & Necessity. 05/28/2009. Submitted to CEC / C. McFarlin on 06/03/2009.
Our Comments
These arguments seem to only uphold the status quo of big utility and energy company centralized power, and contain misleading information on distributed generation.
 The utilities do not want localized energy because they lose control of profits. Southern California Edison, for example, which serves 13 million residents, successfully lobbied against a bill that would have allowed the city of Palm Desert to pay solar users for the excess power they generate.
Fast Company magazine writer Anya Kamenetz says, "The evidence is growing that privately owned, consumer-driven, small-scale, geographically distributed renewables could deliver a 100% green-energy future faster and cheaper than big power projects alone. Companies like GE and IBM are talking in terms of up to half of American homes generating their own electricity, renewably, within a decade. But distributed power -- call it the 'microgrid' -- poses an existential threat to the business model the utilities have happily depended on for more than a century " (from AREP >>here).
See also the U.S. Department of Energy - Energy Efficiency and Renewable Energy
Solar Energy Technologies Program, which endorses photovoltaics:http://www1.eere.energy.gov/solar/printable_versions/myths.html
Timing: Newsweek reported in August that according to the Interstate Renewable Energy Council's 2006-08 count, consumers added 522 megawatts to the grid, while centralized utility power plants added only 96 megawatts. In 2008, 33,500 rooftop solar systems were installed in the United States, a 63 percent increase over the amount of capacity installed in 2007. In California alone the increase was 95 percent (from Newsweek: Taking a Dim View of Solar Energy, by Matthew Phillips, August 25, 2009, >>here).
The speed with which local power generation happens can be amazing: the city of Palm Desert rolled out a program in 2008 funding fixed-rate loans to private homeowners for
rooftop solar, and within weeks the money had been spent and panels were up on roofs. With distributed generation the power can start in months, rather than the years it takes large power companies such as BrightSource to prepare environmental studies and documents for leasing public lands in pristine remote deserts.
 Cost and Subsidies: Solar Millennium admits each 250-megawatt (MW) solar thermal power plant including storage will cost $1.5 billion (press release November 2009 >>here). BrightSource has estimated the cost of its 400 MW solar thermal power tower in Ivanpah Valley at $2 billion. The only way these companies can build these plants is to get generous federal government loans and grants, as well as property tax and even state sales tax abatements. Given that a typical coal plant can produce 1500 MW, this cost seems to us extremely high for the paltry amount of electricity produced.
And transmission is not cheap -- Los Angeles Department of Water and Power's ill-conceived Green Path North transmission line would purportedly cost $1 billion, inefficiently shipping in power from remote centralized plants with a "line loss" (the power lost during transmission from resistance) as high as 10%. Transmission can cost up to $10 million a mile.
What would happen if individuals or small businesses could apply for a federal grant to cover 30% of the construction costs of a rooftop photovoltaic system or microturbine wind generation? Not a loan to be paid back, but an outright giveaway of taxpayer money from the US Treasury. This is what companies like BrightSource and Solar Millennium are applying for and why they need to get their permits before December 31, 2010, to make the government-set deadline to qualify for such grants.
In the utility model, ratepayers feed the profits of the utilities and their shareholders. In the microgrid, distributed generation model, home-owners and businesses who invest in saving and generating their own electricity get the returns.
Amory Lovins, of the Rocky Mountain Institute, in book, Small Is Profitable, says, "Micropower growth is very rapid, and it's almost wholly financed by private capital. Distributed renewables in 2007 got $91 billion of new private investment... . There are several quite distinct reasons for thinking that these stats I've just given you are the leading edge of a tsunami of change in the power sector."
Lovins concludes that because the scale lowers capital risk, the economic benefits of a dollar invested in distributed renewables can be an order of magnitude greater than the same dollar invested in conventional power plants.
Managing director at GE, Kevin Skillern, sees huge growth in distributed generation: "The small-wind market is currently just $100 million in total sales but has been growing 40% to 50% a year for a handful of years. The combination of stimulus programs and technology advances make this a highly economic purchase for nearly half of the U.S. population....
From the perspective of both our venture-capital group and some of the senior people within GE Energy, distributed generation is going to happen in a big way." (From Kamenetz in AREP >>here)
California distributed generation expert Sheila Bowers, who has been working hard to get lawmakers to pass bills that will increase the ability of homeowners to generate their own power and integrate with utilities, responds to the Ivanpah FSA eliminating DG as an alternative: "Firstly, they try to act like we don’t want rooftop solar and it would require too many subsidies to motivate people. This is just a lie, largely successful because they have refused to implement the types of programs that would cut into utility profits, instead of bleeding ratepayers dry. THAT is the entire crux of the problem – pandering to utility profits at any cost. First of all, most people in our area, for a VERY MODEST ROI, even a monthly break-even, would install solar. Secondly, every home and business would pay 100% of the cost of their PV system out of their own money, even if that money is initially loaned via AB 811. So, every kW installed as a rooftop system is FREE to non-generating ratepayers and 'society.' The infrastructure will be completely FREE (other than the person installing, which I’m getting to). That is cheaper than paying a huge amount for new substations and transmission lines, owned by utilities and used to further hijack us, right? Those who install will see their bi-annual AB 811 loan payments returned to them each month in the form of reduced electricity bills and FITs, so rooftop PV will also be FREE to people who install – if we only have simple, non-subsidy-based fair market programs."
Bowers continues, "Once the system is up and running, and producing power, 60 – 100% of the power will be consumed onsite and net metered. That means (1) that the ratepayer generator will see a return on investment through avoided electricity bills and (2) that non-generating ratepayers will not pay one single cent, even though HUGE amounts of solar have entered the mix. So the 'societal cost' of net metered electricity is, again, zero. The only cost is in lost revenue to utilities, which, of course, also significantly reduce fuel and distribution costs, so essentially, they are only losing SPECULATIVE profits, and no longer getting the unfair financial benefits of being a monopoly. We can all live with that, I think – it’s our legislators who aren’t willing to...do the right thing. Utility profits cannot be sacrosanct in an evolving world where the REAL goals of sustainability and democracy without rate hikes have to take precedence. We gave them over a century to monopolize power, it’s our turn now."
Feed-In Tariffs: Feed-in tariffs offer the same financing deal to citizens at large that utilities get on any power plant they build. These tariffs have been adopted in 47 countries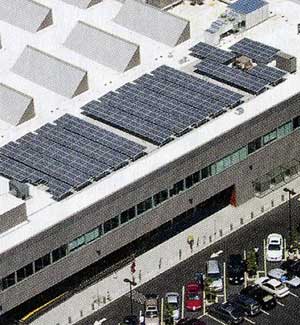 with Germany the global leader. The policy was introduced there back in 1999, and the incentive increased in 2004, guaranteeing small rooftop-solar producers four times the market rate for 20 years for any electricity they sells back to the grid. That year, installations of solar panels jumped from an average of less than 6 megawatts
annually to 600 megawatts; the total is now 5.4 gigawatts of solar. That increased volume created a quarter-million jobs.
Gainesville, Florida, became the first U.S. city to adopt a feed-in tariff, targeted to add 4 megawatts of solar a year for the next 10 years. The city reached its 2009 cap in just three weeks and its 2010 cap days later. Entrepreneurs are moving in to finance, install, and maintain solar panels on homes and malls across the city. Eventually higher volume could bring down prices enough so that incentives can be phased out.
Bowers discusses FITs in California: "[I]n areas like ours, the successful models of feed in tariffs is NET of net metering, so the utility would only need to pay for the EXCESS POWER fed into the grid by ratepayer-generators, not 100% of the power generated. As noted above, that will only be 0% to 40% (estimated) for any given installation (closer to 0 for most), and since the utility re-sells the high-value peaker power, there will often be NO incremental cost between an FIT of 50 cents/kWh and what the utility can re-sell that high-value power for (up to 75 cents for SCE). So, again, for all that re-sold high-end power, there is ZERO cost to society. As production increases, and more and more rooftop solar is producing, and the utility has to start selling into the cheaper tiers, we will start to see a very modest cost to 'society' for the small amount of power that FITs pay for, but it is FAR FAR LESS than they are trying to claim, because when they use their cost comparisons, they pretend that 'society' has to pay the full installation price plus the FIT, and that is simply a lie. Society pays only the very very incremental cost of production NET of net metering and NET of resale retail rates, which is infinitesimal."
"So, if a home is producing 6,300 kWh/year (about average for 3.5 kW system in LA) and using 6,000 kWh/year, it is producing 300 kWh/ year more than it uses. If that homeowner is being paid 50 cents/kWh for the excess, and the utility resells that power for 39 cents/kWh, the 'cost to ratepayers' is 11 cents/kWh times 300 = $33/year. The 'benefit to society' however, is 6,300 kWh of clean power displacing dirty power, which makes the 'societal cost' of putting 6,300 kWh of clean, democratically owned solar power at $30, or ~.5 cents/kWh (one half of one cent per kWh). The ratepayer generator who made the choice to oversize and conserve, enjoys a cash payment of $150/year to help offset the cost of system and get a return on that investment (in addition to 100% net metering offsets). The ONLY 'loss' across all of society, is that the utility will no longer be the exclusive generation monopoly, so will not get it’s profit margin for selling power it didn't produce. Oh well, right? "
Bowers says, "So, essentially, we are taking what was a corrupt monopoly, breaking it up so that we are now participants in the renewable energy marketplace, displacing dirty fossil fuels and their profit margins to utilities with clean, democratic, sustainable power that WE own and are paid for. There is virtually NO cost increase to ratepayers for this genuinely cheap, fast, and green plan, which is EXACTLY why they hope we don’t run these numbers... This is enough of a solution to hit our full 33% RPS, and as storage solutions come online, to surpass it."
Size and Scale: If there's so much potential in the microgrid, why hasn't it already hit gigawatt scale in the United States? All investor-owned utilities are built on the central-generation model of a large centralized power plant. Distributed generation is local, so utilities lose control of billing for electricity.
In 2002, the largest rooftop solar power system in the United States — a 1.18-MW system — was built at the Santa Rita Jail in Dublin, Calif.
With close ties between power companies and state regulators, they can put up a variety of roadblocks to see that rooftop-solar programs remain too small. The nonprofit Network for New Energy Choices puts out an annual report called "Freeing the Grid," tracking the growth of microgrid-friendly policies. Forty-two states now have rules allowing some form of net metering, where a rooftop solar owner receives retail credit for at least a portion of the electricity they generate. But many states' rules are too restrictive to allow the average person to participate, and utilities often lobby against supportive legislation.
Net-metering. (Courtesy www.thatsolarguy.com/faq/incentives.htm)
Duke Energy, which is trying to build a wind farm by the town of Searchlight, Nevada, has actively fought net metering, saying they will lose revenue. Or they want to own the photovoltaic panels on people's roofs so they can profit.
The Los Angeles Department of Water and Power (LADWP) is the largest city-owned utility in the country, and it has been fighting local renewable energy as well. In 1999, when the
first green-energy incentives were passed in the city, LADWP cut a deal with the city's top 30 users of electricity, offering them 5% discounts for 10 years in exchange for not building on-site generation or installing solar power. This includes L.A.'s public school system, the biggest energy customer in the city, which was then launching a huge renovation, building 100 new schools that all could have had solar rooftops.
Interestingly in light of the scale of solar power, LADWP thought it could install (and own) 400 MW of rooftop solar on commercial and government buildings right in the city -- the maximum amount that the remote desert Ivanpah Solar Electric Generation system would supposedly provide, but LADWP would not have to push for long transmission lines with its rooftop scenario.
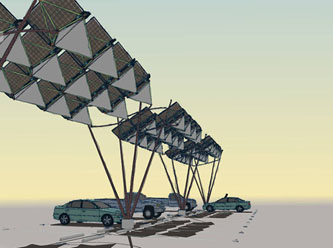
^Airport parking lot photovoltaic structures. (Courtesy www.phatenergy.com)
Legislation: With the right policies in place distributed generation can work, but lawmakers need to be prodded in the right direction and the public must be vigilant against utilities and companies that want to hog the subsidies and profits to themselves.
Allan Schurr, the VP of strategy and development at IBM's energy and utilities group, says simply, "Distributed energy is happening." he continues, "It's inevitable that consumers will continue to want to exercise more involvement in energy decisions. Our research shows that only 30% of consumers are satisfied with the passive ratepayer role. I think consumers will articulate their needs to utility providers directly and indirectly through the political process and utility commissions. I don't think utilities can make unilateral choices here. The force is very strong." (From Kamenetz in AREP >>here)
See Alliance for Responsible Energy Policy.
Other Alternatives
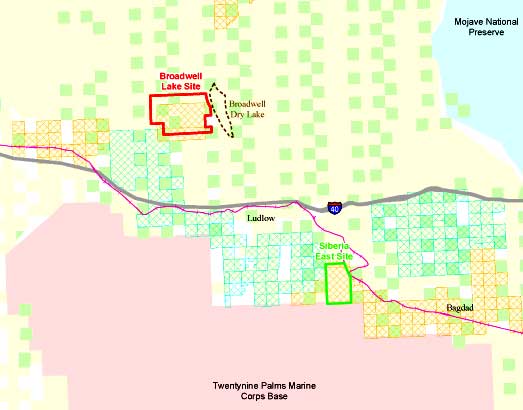
<Broadwell Lake alternative for the ISEGS (page 4-92). Orange cross-hatched squares are other solar proposals, green cross-hatched are wind proposals. Solid green squares are Catellus lands which are incorporated partly into Senator Diane Feinstein's Mojave Trails National Monument bill, along old Route 66.
The FSA/DEIS analyzes 22 alternatives, including the above distributed generation alternative, which they eliminated without giving a correct analysis in our opinion.
"NEPA requires that reasonable alternatives are not limited to ones the lead agency can
adopt, and the agency should consider wide-reaching alternatives when the problem at
hand is a broad one, such as a large-scale energy supply issue. (See Natural
Resources Defense Council, Inc. v. Morton (D.C. Cir. 1972) 458 F.2d 827, 836 ('Morton').) Further,'“[i]n determining the scope of alternatives to be considered, the
emphasis is on what is ‘reasonable’ rather than on whether the proponent or applicant
likes or is itself capable of carrying out a particular alternative...' (CEQ Forty Questions,
No. 2a.)" (pages 4-3-4).
What hampers a good alternative is the unnecessary constriction that the alternative must "complete the impact analysis of the project by the first quarter of 2010 so that if
approved, construction could be authorized in 2010 and beyond" (page 4-5).
Site Alternatives Eliminated
• Siberia East alternative
• Broadwell Lake alternative
• Private Land alternative
• I-15 alternative
• Ivanpah Site A alternative
• Ivanpah Site C alternative
• West of Clark Mountain alternative
• Reduced Acreage alternative
Renewable Solar Alternatives Eliminated
• Parabolic Trough Technology
• Stirling Dish Technology
• Linear Fresnel Technology
• Solar PV Technology
• Distributed Solar Technology
Other Renewable Alternatives Eliminated
• Wind energy
• Geothermal energy
• Biomass energy
• Tidal energy
• Wave energy
Alternative Methods of Generating or Conserving Energy Eliminated
• Natural Gas Generation
• Coal Generation
• Nuclear Energy
• Conservation and Demand Side Management
The Private Land alternative was not considered because "achieving site control in an
economically feasible manner would be more challenging than at the proposed site
because land would have to be acquired from multiple landowners and would create
significant impacts of its own". The Sierra Club had developed a plan to consolidate scattered private lands into renewable energy zones (see our report on the Palm Desert Congressional Hearing), but this idea has never been considered by government agencies or lawmakers. Given more time without unrealistic deadlines, this alternative could be viable and obviate the need to undergo lengthy environmental reviews that are bogging down many current public lands renewable projects.
Private land was considered where the first two solar power tower facilities of the Solar Electric Generating System (SEGS), built in Daggett by LUZ Industries, were installed. The area has approximately 2,000 acres of agriculture land. However, sufficient disturbed land is not available to build a 400 MW solar power facility without interfering with a number of existing residential areas, says CEC/BLM. Additionally, the area surrounding the original SEGS facilities is located within 2,000 feet of the Barstow-Daggett Airport and would potentially conflict with the Federal Aviation Regulation Part 77 – Objects Affecting Navigable Airspace, specifically the surface structure height would potentially obstruct or impede air navigation. To make up the 4,000 acres needed, the applicant would want to clear more than 3,000 acres of Mojave Desert scrub habitat adjacent to the private lands, and this would impact many other sensitive species, including the Mojave ground squirrel. Plus the Daggett-Newberry Springs area is more built-up and visual impacts would be greater to residences, states the FSA.
At the request of the National Parks Conservation Association, a site west of Clark Mountain was considered as a means of reducing visual impacts to the Mojave National Preserve. But according to CEC/BLM the only land areas west of Clark Mountain that is not within a Desert Wildlife Management Area for tortoise, is not military land, and that achieves the appropriate solarity and slope requirements have renewable applications pending before BLM.
The BLM land alternative at Broadwell Lake and the Siberia East alternative along historic Route 66 and near Ludlow, east of Barstow, California, were eliminated because BrightSource already has pending applications at those sites, and other solar companies also have claimed the areas nearby. CEC/BLM also say that these sites would also have similar environmental impacts to developing the Ivanpah Valley site. Since the FSA/DEIS was released, Senator Feinstein introduced a bill that would make these areas part of "Mojave Trails National Monument," further complicating the matter. We ask, if these sites are considered worthy of inclusion as National Park Service units, why is Ivanpah Valley not? Ivanpah Valley could easily qualify as an addition to the Mojave National Preserve, we believe.
The Sierra Club proposed he "I-15 Alternative" of moving the ISEGS project down the fan to next to the highway in Ivanpah Valley. The FSA/DEIS says this would have similar impacts to biological resources, and glare would be more of a problem for drivers.
BrightSource considered other areas, such as to the south in Ivanpah Valley, but longer pipelines to the Kern River natural gas pipeline would have to be built, and the SCE transmission line would have to be longer. The alternatives would also be closer to Mojave National Preserve. One site was at first proposed in a tortoise Desert Wildlife Management Area (DWMA).This plan was dropped.
Various other solar power plant options, such as parabolic trough solar thermal and utility-scale photovoltaic, were eliminated as alternatives because they had a similar large footprint and would create the same huge impacts to the environment. Wind power was dropped for similar reasons.
Biomass energy was dropped because "most biomass facilities produce only small amounts of electricity (in the range of 3 to 10 MW) and so could not meet project objectives. Biomass facilities also generate significant air emissions and require numerous truck deliveries to supply the plant with the waste. Also, in waste-to-energy facilities, there is some concern regarding the emission of toxic chemicals, such as dioxin, and the disposal of the toxic ash that results from biomass burning. Therefore, this technology is not analyzed in detail as an alternative to the ISEGS project" (page 4-70).
Natural gas and coal were eliminated because they are not renewable.
Conservation of energy and demand-side management was eliminated because of forecasted population growth and the continued need for more energy; also these would not provide the renewable energy needed for the California Renewable Portfolio Standard (which we feel is placing impossible demands for deadlines on utilities and the resources of the state).
But hybrid power plants next to cities were not considered as an alternative. The proposed Palmdale Hybrid Power Project in the city of Palmdale, Los Angeles County, was announced on December 23, 2009. It would be a 570-megawatt natural gas-fired combined cycle generating facility with 10 percent parabolic solar thermal on about 377 acres in the city's northern portion. The land use here is very small compared to ISEGS's 4,000 acres of pristine desert, and the amount of electricity generated would be much greater. Hybrid power plants should be considered, especially in the city-owned land, next to the users. This eliminated the need to giant and pricey transmission lines also. See the California Energy Commission page >>here.
Compare:
ISEGS - 4,000 acres ............400 MW at 25% capacity factor = 100 MW
Hybrid - 377 acres ...............570 MW at 60% capacity factor = 342 MW
(for more on capacity factor see Reliability)
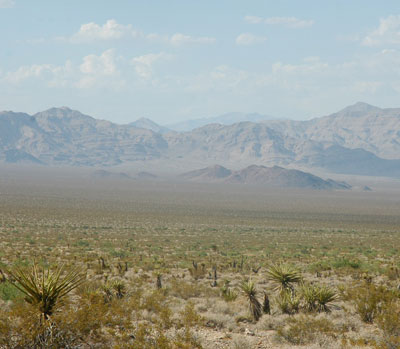
^Joshua tree woodland near the ISEGS site on Mountain Pass. Will we sacrifice places like this, or ask our legislators for better policies of local power generation?
HOME.....Page 1.....Page 2.....Page 3.....Page 4.....Page 5
Ivanpah SEGS Updates.....ISEGS Overview.....Last Spring at Ivanpah...?